


How SAR command work in LINUX VPS
SAR stands for System Activity Report, as its name suggests command is used to collect, report & save CPU, Memory, and I/O usage in Unix an operating system. The SAR command produces the reports on the fly and can also save the reports in the log files as well.
This article explains how to install and configure the sysstat package (which contains the SAR utility) and explains how to monitor the following Linux VPS performance statistics using SAR.
- Collective CPU usage.
- Individual CPU statistics.
- Run queue and load average data.
- Swap space used and available.
- Report SAR data from a specific time.
- Individual device I/O activities.
- Memory used and available.
- Context switch statistics.
- Network statistics.
- Overall I/O activities of the system.
How to install SAR in LINUX?
1. Install Sysstat Package
First, make sure the latest version of SAR is available on your system. Install it using any one of the following methods depending on your distribution.
- # sudo apt-get install sysstat
- # yum install sysstat
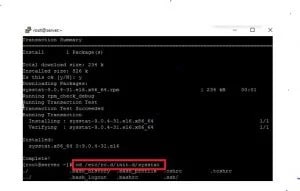
Note: Make sure to pass the option –enable-install-cron. This does the following automatically for you. If you don’t configure sysstat with this option, you have to do this ugly job yourself manually.
Creates /etc/rc.d/init.d/sysstat
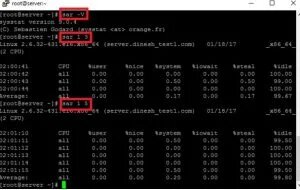
2. Once installed, verify the SAR version using “SAR -V”
Finally, make sure SAR works. For example, the following gives the system CPU statistics 3 times (with 1 second interval).
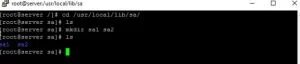
3. Collect the SAR statistics using cron job – sa1 and sa2
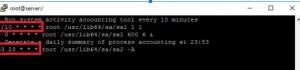
/usr/local/lib/sa/sa1
This runs every 10 minutes and collects SAR data for historical reference.
If you want to collect SAR statistics every 5 minutes, change */10 to */5 in the above /etc/cron.d/sysstat file.
This writes the data to /var/log/sa/saXX file. XX is the day of the month. saXX file is a binary file. You cannot view its content by opening it in a text editor.
/usr/local/lib/sa/sa2
This runs close to midnight (at 23:53) to create the daily summary report of the SAR data.
sa2 creates /var/log/sa/sarXX file (Note that this is different than the saXX file that is created by sa1). This sarXX file created by sa2 is an ASCII file that you can view in a text editor.
4. Linux 2.6.32-431.e16 – Linux kernel version of the system.
01/18/2017 – The date when the SAR data was collected.
_x86_64_ – The system architecture.
(2 CPU) – Number of CPUs available on this system. On multi-core systems, this indicates the total number of cores.
1.
CPU Usage of ALL CPUs (SAR -u)
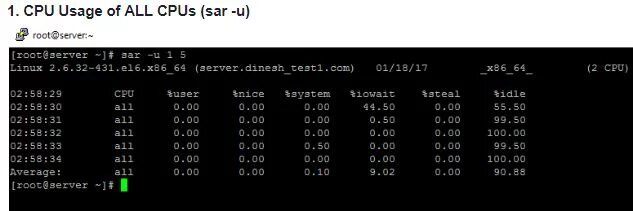
This gives the cumulative real-time CPU usage of all CPUs. “1 5” reports for every 1 second a total of 5 times. Most likely you’ll focus on the last field “%idle” to see the CPU load.
- SAR -u Displays CPU usage for the current day that was collected until that point.
- SAR -u 1 5 Displays real time CPU usage every 1 second for 5 times.
- SAR -u ALL Same as “SAR -u” but displays additional fields.
- SAR -u ALL 1 5 Same as “SAR -u 1 5” but displays additional fields.
- SAR -u -f /var/log/sa/sa10 Displays CPU usage for the 10 days of the month from the sa10 file.
2.
CPU Usage of Individual CPU or Core (SAR -P)
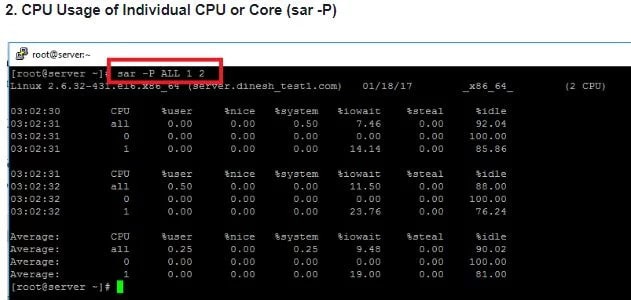
If you have 4 Cores on the machine and would like to see what the individual cores are doing, do the following.
- “-P ALL” indicates that it should display statistics for ALL the individual Cores.
- In the following example under “CPU” column 0, 1, 2, and 3 indicates the corresponding CPU core numbers.
3.
Memory Free and Used (SAR -r)
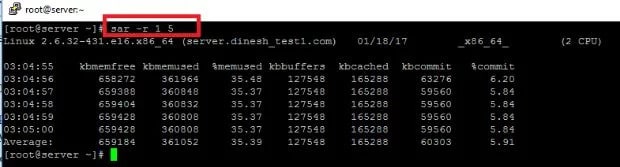
This reports the memory statistics. “1 5” reports for every 1 second a total of 5 times. Most likely you’ll focus on “kbmemfree” and “kbmemused” for free and used memory.
Following are a few variations:
- # sar -r
- # sar -r 1 5
- # sar -r -f /var/log/sa/sa10
4.
Swap Space Used (SAR -S)
This reports the swap statistics. “1 5” reports for every 1 second a total of 5 times. If the “kbswpused” and “%swpused” are at 0, then your system is not swapping.
Following are a few variations:
- # sar -S
- # sar -S 1 5
- # sar -S -f /var/log/sa/sa10
5.
Overall I/O Activities (SAR -b)
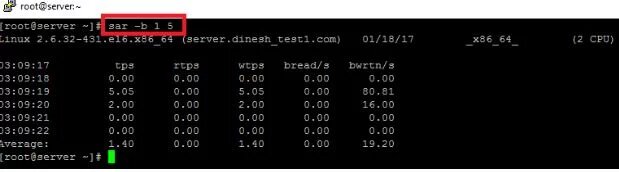
This reports I/O statistics. “1 5” reports for every 1 second a total of 5 times.
The following fields are displays in the example below:
tps –
Transactions per second (this includes both read and write).
rtps –
Read transactions per second.
wtps –
Write transactions per second.
bread/s –
Bytes read per second.
bwrtn/s
Bytes written per second.
Following are a few variations:
- # sar -b
- # sar -b 1 5
- # sar -b -f /var/log/sa/sa10
6.
Individual Block Device I/O Activities (SAR -d)
To identify the activities by the individual block devices (i.e a specific mount point, LUN, or partition), use “SAR -d”
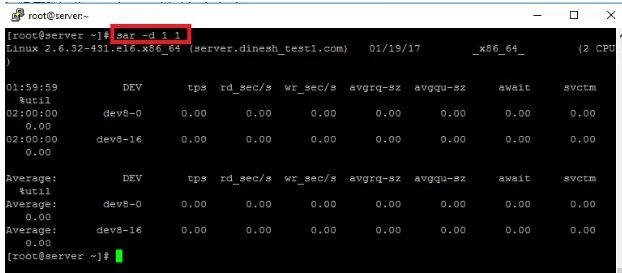
Following are a few variations:
- # sar -d
- # sar -d 1 1
- # sar -d -f /var/log/sa/sa10
- # sar -p -d
7.
Report network statistics (SAR -n)
This reports various network statistics. For example, the number of packets received (transmitted) through the network card, statistics of packet failure, etc., “1 5” reports for every 1 second a total of 5 times.
- # sar -n KEYWORD
KEYWORD can be one of the following:
- # sar -n DEV 1 1
DEV –
Displays network devices vital statistics for eth0, eth1, etc.
EDEV –
Display network device failure statistics.
NFS –
Displays NFS client activities.
NFSD –
Displays NFS server activities.
SOCK –
Displays sockets in use for IPv4.
IP –
Displays IPv4 network traffic.
EIP –
Displays IPv4 network errors.
ICMP –
Displays ICMPv4 network traffic.
ICMP –
Displays ICMPv4 network errors.
- Display context switch per second (SAR -w).
This reports the total number of processes created per second, and the total number of context switches per second. “1 5” reports for every 1 second a total of 5 times.
- # sar -w 1 5
8.
Reports run queue and load average (SAR -q)
This reports the run queue size and loads an average of last 1 minute, 5 minutes, and 15 minutes. “1 5” reports for every 1 second a total of 5 times.
- # sar -q 1 5
By using the SAR command we can find out the performance status of the server.
Conclusion
Still confused how SAR command work in LINUX VPS? Contact Ideastack now!
Frequently Asked Questions
Q1. What is sar command used for?
The sar command can be used to keep track of a variety of system resources on a Linux system, including CPU and memory usage, file system performance, I/O device consumption, network monitoring, disk usage, process and thread allocation, battery life, plug-and-play device performance, and more.
Q2. How does sar collect data?
Using SAR, gathering, and reporting resource data requires two steps. The first step is to collect test data and save it as a binary file. In the second step, extract the desired data into a text (.txt) report.
Q3. Where are sar files stored?
The term “sar” refers to “system activity report,” and it can be configured to automatically generate daily reports, display current performance, or deliver reports based on log files kept in the /var/log/sa (or /var/log/sysstat) folder on your system.
